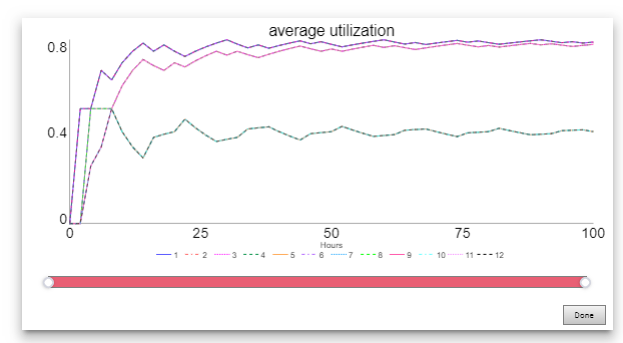
The expanded graph dialog comes up when you click on the expand graph button (![]() ) in the lower right hand corner of the graph. This button is visible when you select the Show Expand Button checkbox in the Graph Settings Properties Panel.
) in the lower right hand corner of the graph. This button is visible when you select the Show Expand Button checkbox in the Graph Settings Properties Panel.

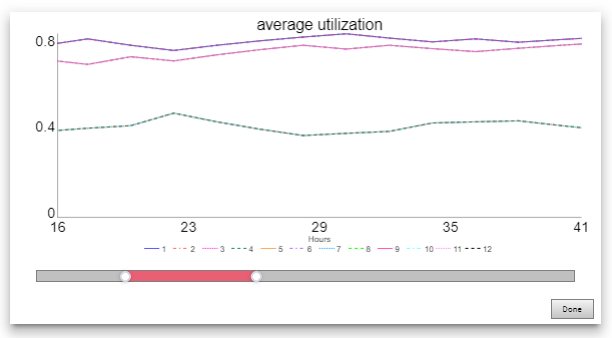
The expanded will take up the entire interface page (covering all other elements of the interface). You can use the slider along the bottom to zoom in on a subset of the full time range for the graph. For example, drag the left handle ( ) to the right to start at a later time and the right handle (
 ) to the right to end at an earlier time.

The narrowed time range affects only the current graph. It will not be kept when the window is closed.
Click on Done to close the expanded graph and return to the interface.